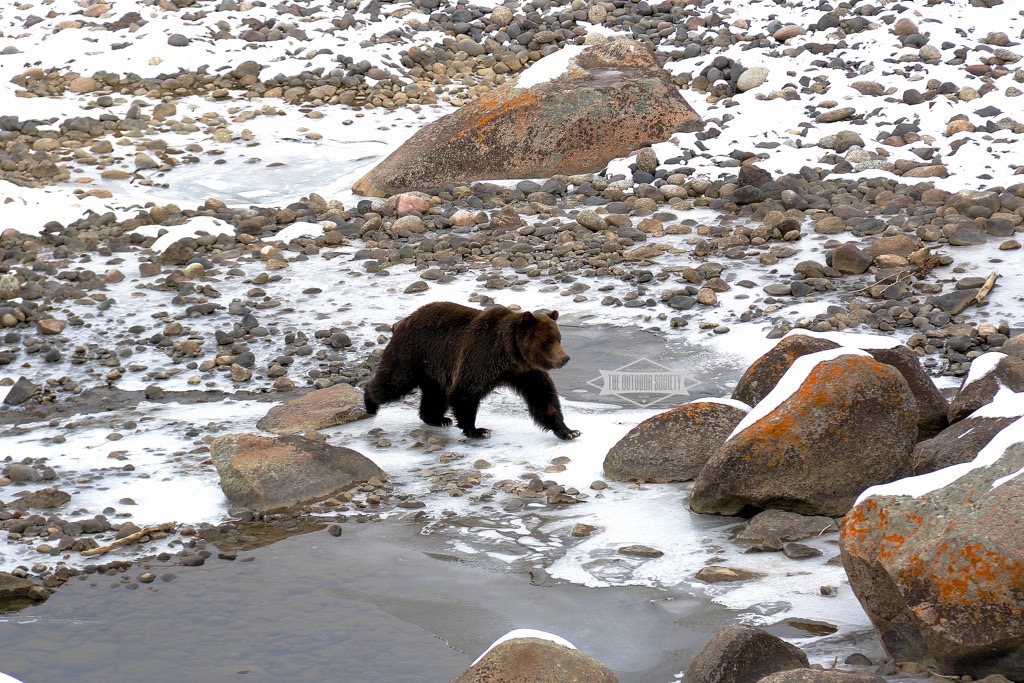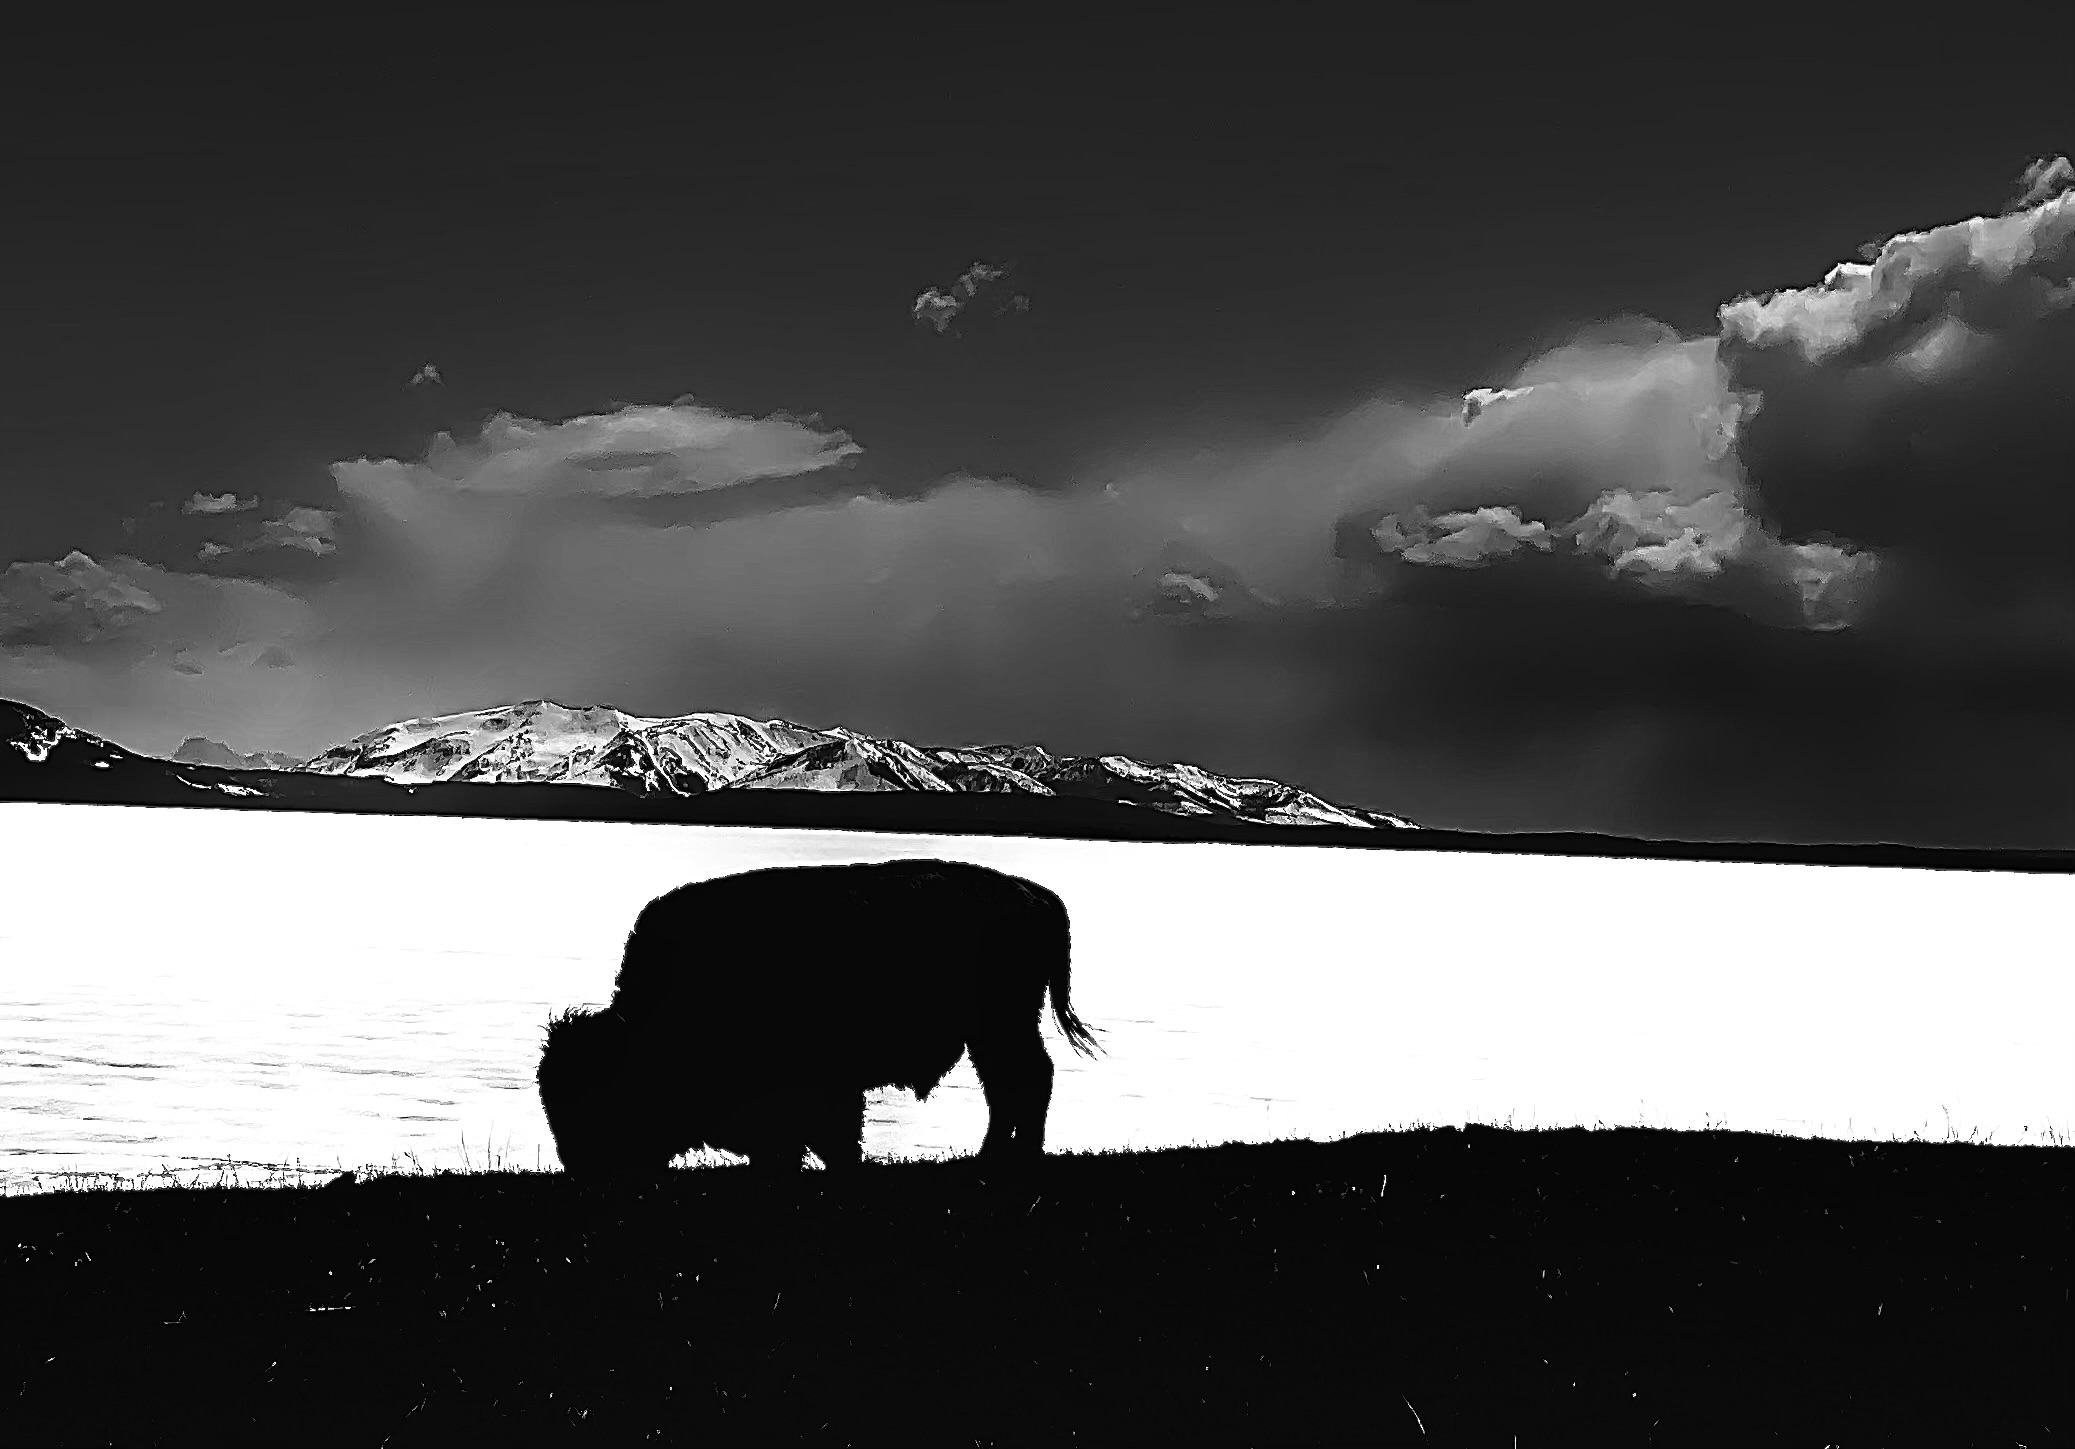
With visitors exploring the rainforests, hiking on the ridges and wandering along the rugged coast, Olympic National Park was a popular place in 2017. During a year which saw washouts and road closures, smoke-filled views and the reopening of popular areas, nearly 3.5 million people explored America’s 8th most-visited National Park.
As always, I poured over the stats and found some cool things. While I will eventually be sharing those findings, we thought it would be cool to show you what areas are popular in the park and whether or not 2017 saw an increase or decrease in visitation for each region. All data is from the official National Park Service website for visitation and statistics. Have an issue with the numbers or disagree? Call DC.
Olympic National Park’s Most Popular Regions in 2017

Lake Crescent was the most visited region in Olympic, which is usually the case. In 2017, Lake Crescent saw 1,075,442 recreation visitors. While impressive, this region actually saw 7% less visitors than in 2016. This decrease in visitation was most-likely due to road construction during the popular summer months limiting traffic and creating headaches for people on road trips.

Kalaloch comes in second for visitation in 2017, with 665,672 recreation visitors. Kalaloch is also always a popular place, thanks to the close proximity to Highway 101. This region experienced a 4.3% increase in visitation from 2016, also possibly due to construction on the north end. The warm, sunny weather and lack of smoke also helped bring people to the coast.

Hurricane Ridge is third, but barely. While the Hurricane Ridge region saw 427,320 recreation visitors, this number is a 20% decrease from 2016. Blame the smoke from the BC fires and the longer lasting snow for this, as both directly impacted the ability and desire for visitors to explore this corner of the park.

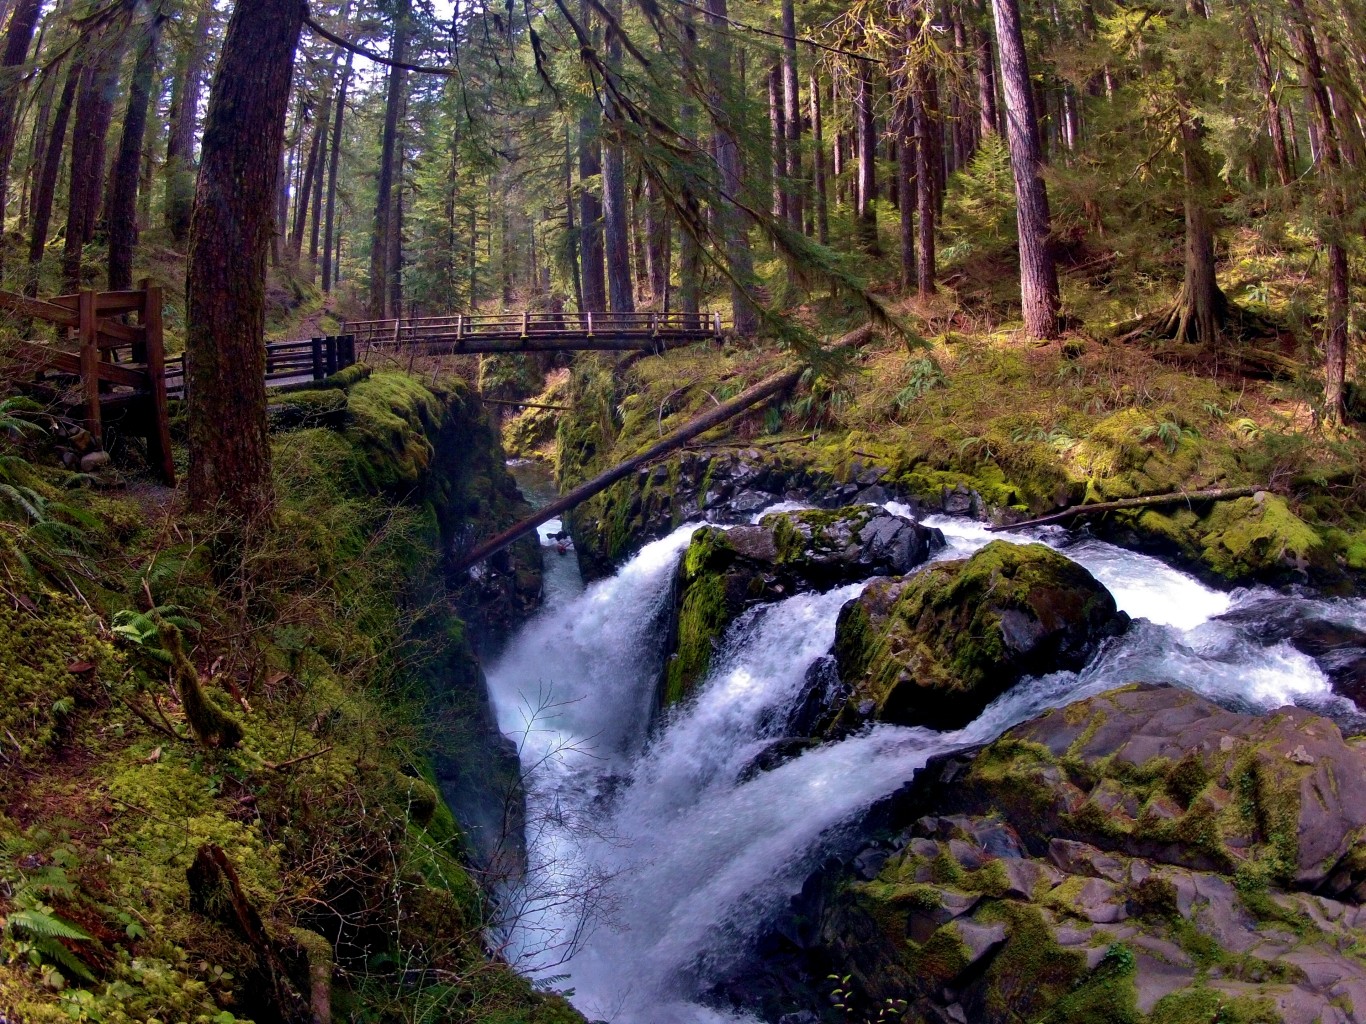
The Hoh Rainforest comes next, nearly passing Hurricane Ridge. In 2017, Olympic reports that 413,288 recreation visitors experienced the majesty of the Hoh Rainforest. While the Hoh is always popular, the region experienced a 24% increase in visitation from 2016’s numbers. What led to this increase? Good weather, great hiking and the increasing popularity of the Quietest Square Inch.

Mora, which is the LaPush region of Olympic National Park also had a great year, receiving 336,663 recreation visitors in 2017. This number is a 3% increase over the 2016 numbers. What is interesting about Mora is that while many will say the hiking in this region was crazier than ever, the 2nd and 3rd Beach use only increased 3.4% from 2016. The Mora campground saw a 21% increase in 2017 versus 2016, but a washout closed the campground for awhile in 2016.

Quinault had a down year in 2017, despite seeing 220,462. The 2017 total is 3.9% less than 2016 for this rainforest region. We could blame yet another washout on the road and rough travel conditions, but this is Quinault- it happens all the time. Some locals will assume the region was more popular, but that is manly due to an increase in backcountry camping, despite less visitors. Looks like everyone enjoys the stunning beauty of Quinault’s wilderness.

Ozette is far from everywhere, but that didn’t stop people from heading out and exploring tis corner of the wilderness coast. In 2017, 115,698 people explored Ozette, up 32% from 2016. I find the increase in popularity for Ozette be pretty amazing, as its remote location should theoretically keep it pretty well-hidden. Camping at Ozette increase 159% from 2016, but don’t read too much into that. A warm summer, open roads and a lake that didn’t flood the campground all helped boost these numbers. I have also heard rumors that campground collection in 2016 was mismanaged. Still though, Ozette is getting more popular.

Staircase, the closest entry into Olympic National Park from Tacoma and Olympia, had another year with increased popularity. Each year, Staircase and Hood Canal starts to see more visitation, and 2017 was no exception. Last year, 108,615 recreation visitors explored Hood Canal, up 17% from 2016. The campground at Staircase also saw a 12% increase in visitation. Sadly, the 2018 numbers will be much lower, as a washout has closed Staircase until at least late spring.

Finally, we end at the Elwha. Visitation statistics at the Elwha are as unpredictable as the wild river. In 2016, statistics were not gathered at the Elwha with any sort of accuracy or consistency. In 2017, the numbers were kept, showing that 38,836 people explore the now dam-free river region. After 2018 is over, we will hopefully be able to have a better idea of visitor numbers to compare.

The Top 10 years for visitation in Olympic National Park
1997- 3,848,709
2002- 3,691,310
1995- 3,658,615
1998- 3,577,007
2001- 3,416,069
2017- 3,401,996
2016- 3,390,221
1994- 3,381,573
1999- 3,364,266
1996- 3,348,723
WANT TO FIND YOUR INSPIRATION IN OLYMPIC!
Discover a Hike a Week through Doug Scott’s Olympic National Park Area Guidebook